Are you excited??

Goal : To predict the CO2-emission of a new car.
(1) Importing the required libraries :

(2) Read the csv file :
There are more columns in our data but due to limited space I can only show a few here.

(3) Find out the columns in our data :

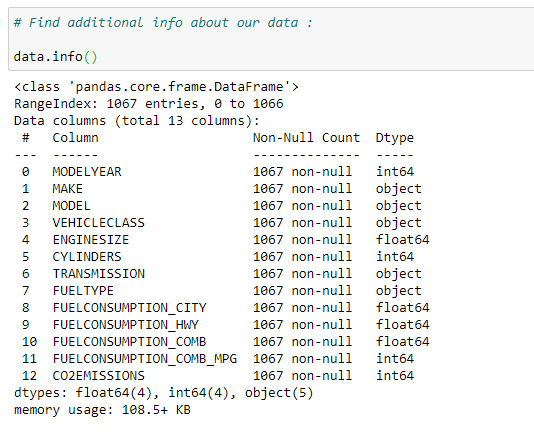
(4) Find additional information about our data :
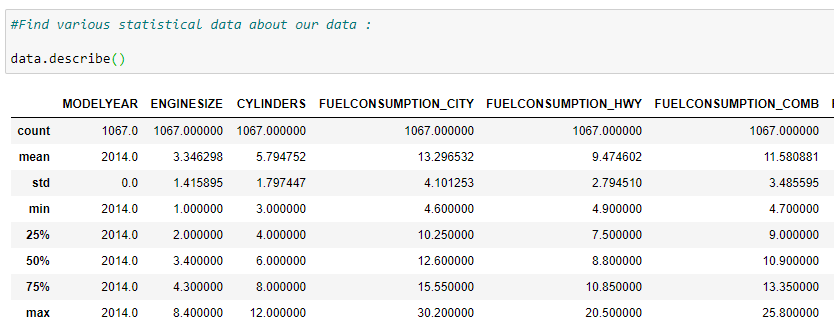
(5) Print various statistical data of our dataset :
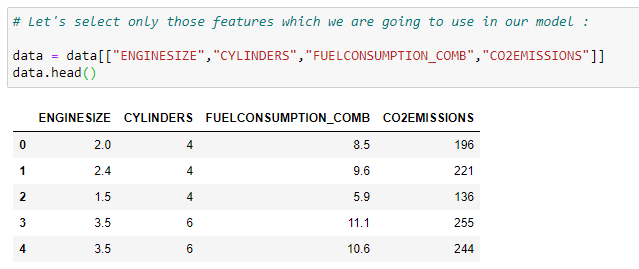
(6) Select useful features from our dataset :
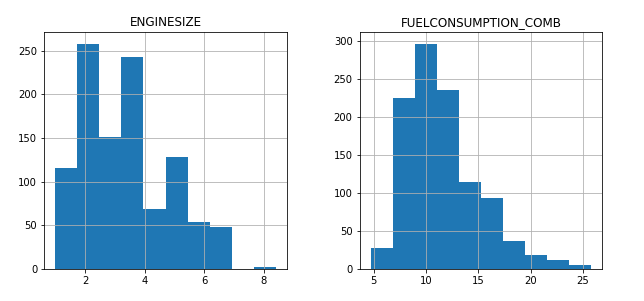
(7) Plot the data with it’s value count :

(8) Plot the data on scatter plot to find out which feature can be used to make the predictions.
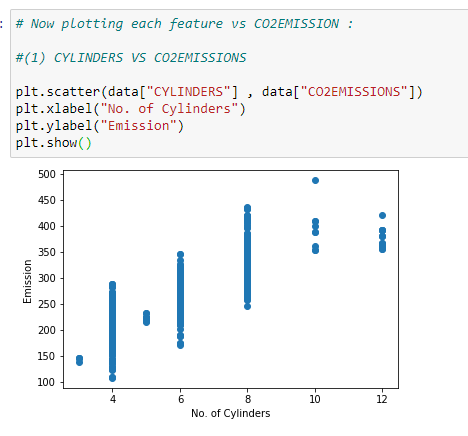
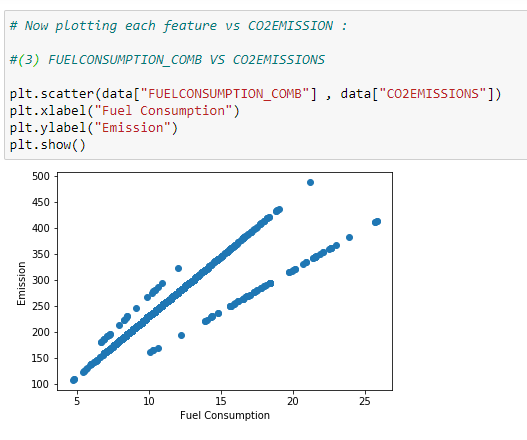
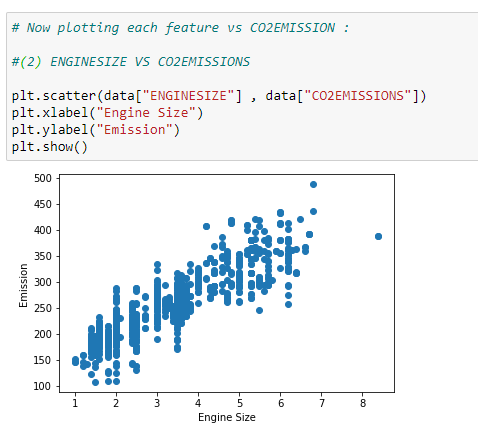
Here we can see that we can easily plot a regression line in ENGINE SIZE VS CO2 EMISSION plot.
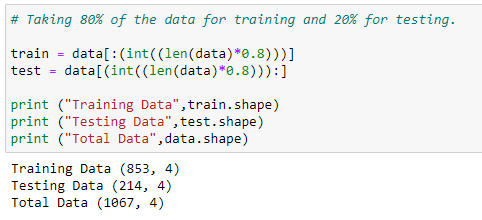
(9) Now we will divide our dataset into 2 parts. One for training data and another for testing data. We’ll use 80% of the data for training and 20% of data to test our predictions.
(10) Finding the mean of CO2-EMISSION :
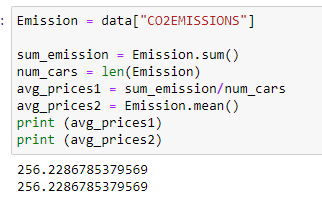
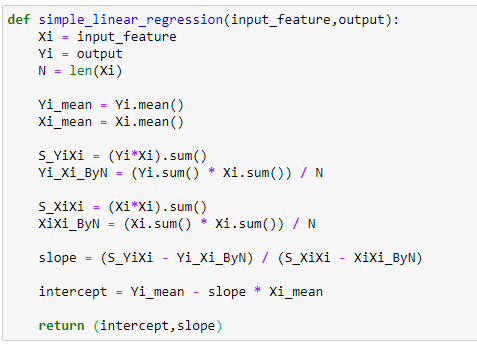
(11) Main function to find slope and intercept. Go check out my last article to understand the derivation of formula used here.
(12) Testing our function with basic data :

Voila! It works perfectly!!
(13) Finding the Slope and Intercept for our actual data :

(14) Now that we have our Slope and Intercept with us we can make our regression line :

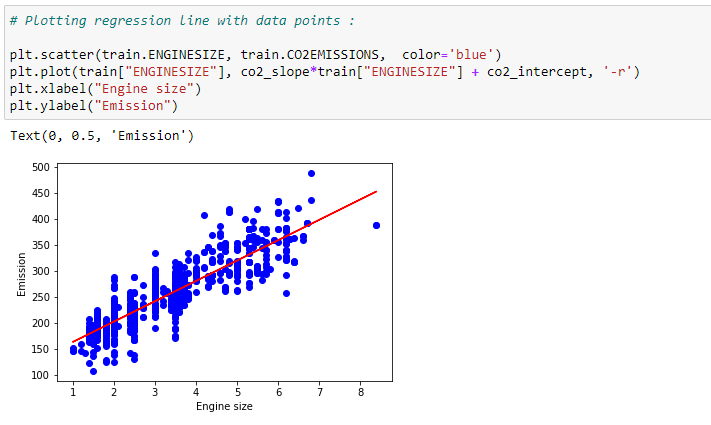
(15) Plot the regression line to visualize it :
(16) Now we’ll predict the values with our model. But first we need to make a function for that :

(17) Can we predict the engine-size from co2-emission? Of course!! Here’s how to it…

Now it’s time to check how well our model performed in predicting the testing values. There are many methods to calculate the error/accuracy of a model. Here we’ll cover a few of them
(1) Residual_Sum_of_Squares :

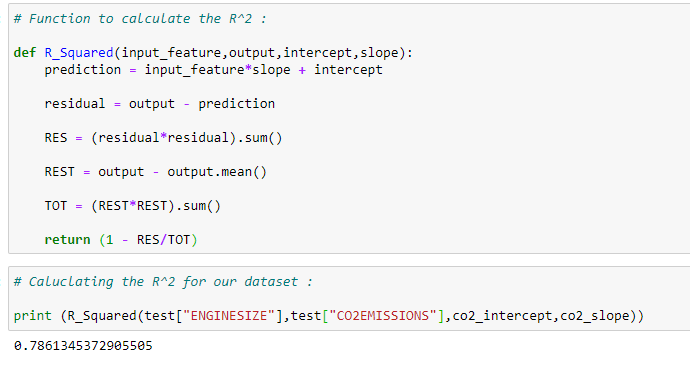
(2) R-Squared :
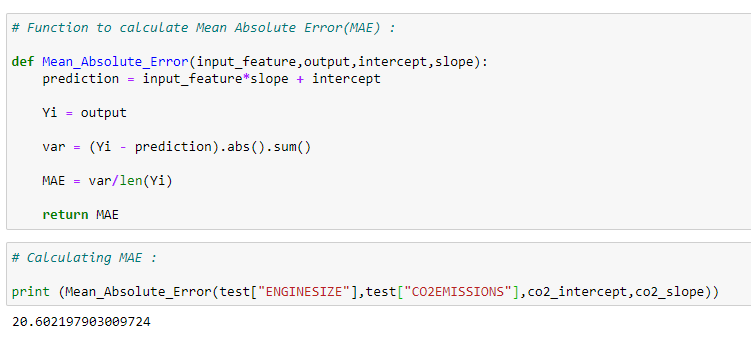
(3) Mean_Absolute_Error (MAE):
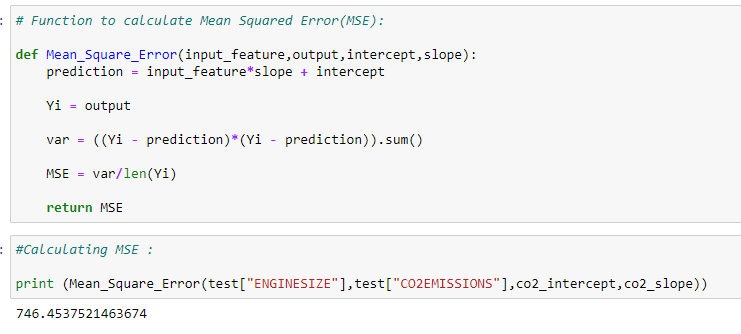
(4) Mean_Squared_Error(MSE):
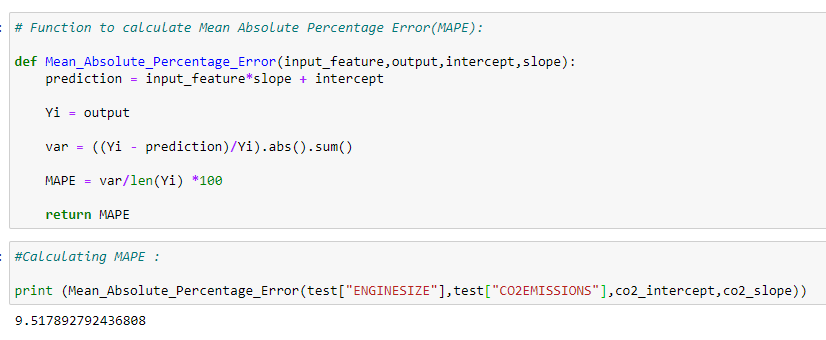
(5) Mean_Absolute_Percentage_Error(MAPE):
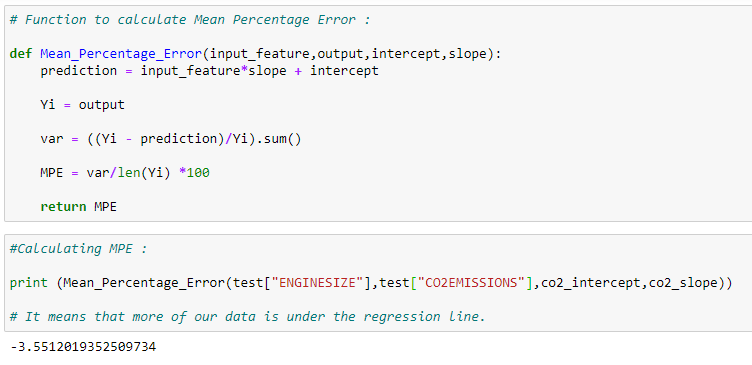
(6) Mean_Percentage_Error(MPE):
In summary, in this article we saw how we can implement simple linear regression without scikit-learn. It’s a lot of work right? But wait..!! There is an easy way to perform the same calculations with same output using some python libraries. In the next article we’ll see how we can perform such complex calculations in minutes with scikit-learn.
In my future articles I will try to show which accuracy model is best for different kind of datasets.
*******
You can download the code and some handwritten notes on the derivation from here : https://drive.google.com/open?id=1_stSoY4JaKjiSZqDdVyW8VupATdcVr67
If you have any additional questions, feel free to contact me : shuklapratik22@gmail.com

No comments:
Post a Comment