Showing posts with label Simple Linear Regression. Show all posts

Saturday, May 16, 2020

Simple Linear Regression Implementation From Scratch (4/5)

In the last article we derived a formula to calculate the “best fit” regression line. Now it’s time to implement it using python. Keep in mind that in this article we are not going to use python libraries such as “scikit-learn” to find the parameter such as slope and intercept of line, but instead we will implement Simple Linear Regression from basic python code and user-defined functions. Here we’ll utilize the formula we derived in the last article to find slope and intercept. We’ll use python libraries such as “matplotlib” to visualize the data and the regression line, but if you don’t want to visualize the data and just want to find the regression line you can skip the code where we use matplotlib to visualize the data.

Are you excited??


Goal : To predict the CO2-emission of a new car.

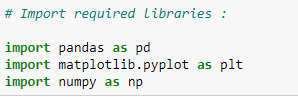
(1) Importing the required libraries :

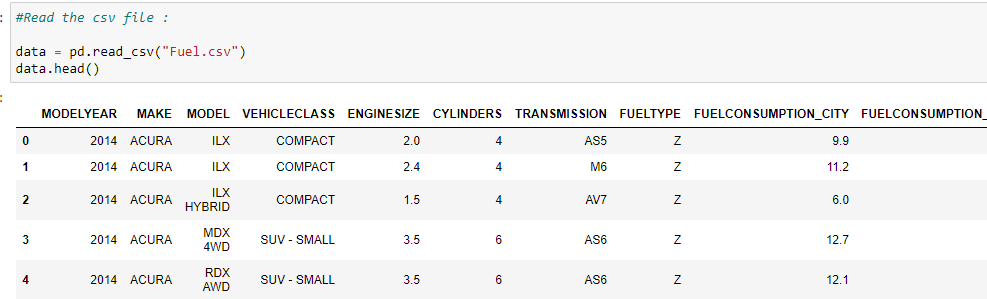
(2) Read the csv file :

There are more columns in our data but due to limited space I can only show a few here.

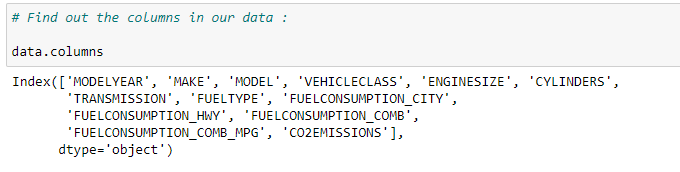
(3) Find out the columns in our data :

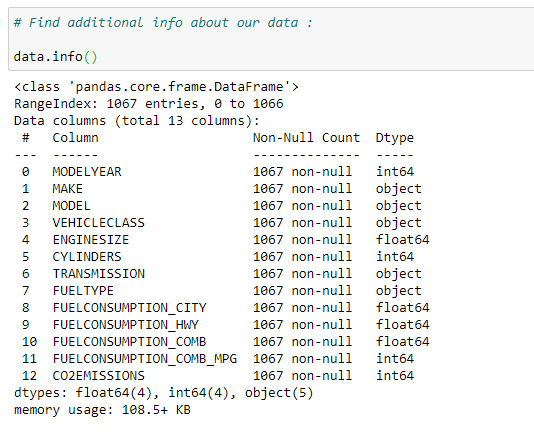
(4) Find additional information about our data :

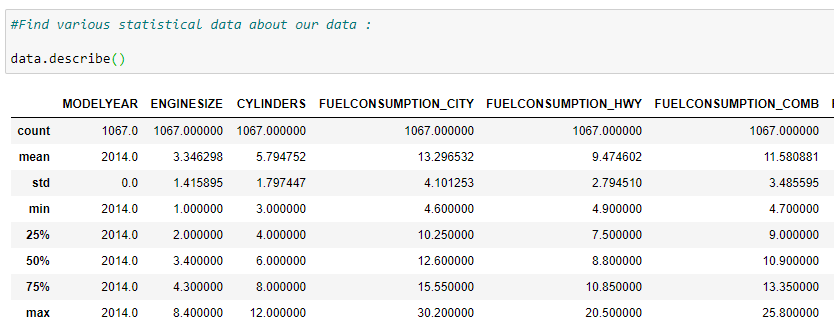
(5) Print various statistical data of our dataset :

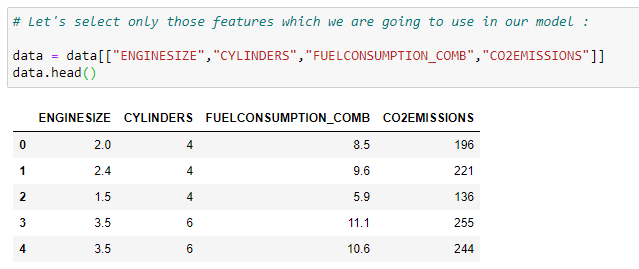
(6) Select useful features from our dataset :

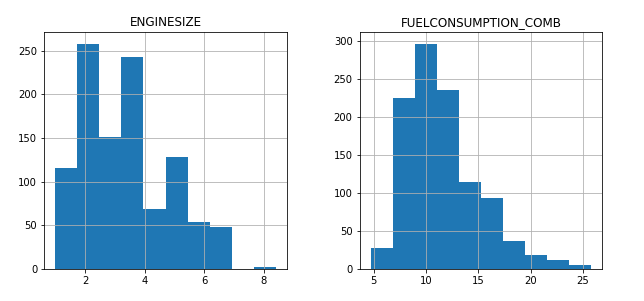
(7) Plot the data with it’s value count :

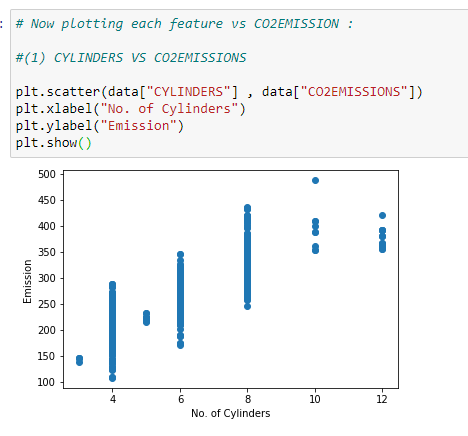
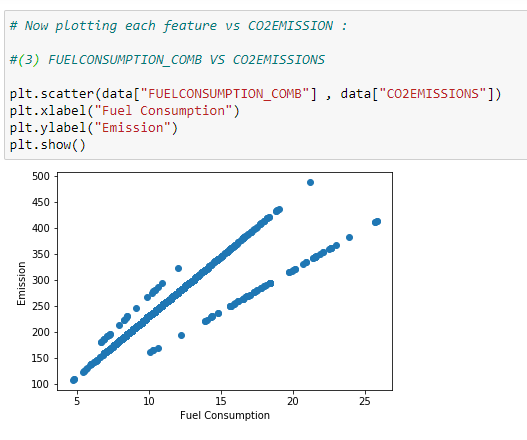
(8) Plot the data on scatter plot to find out which feature can be used to make the predictions.

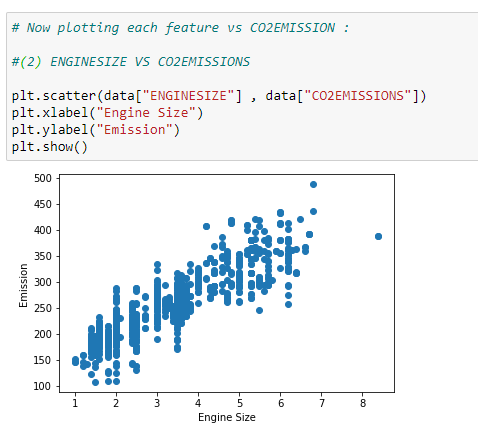
Here we can see that we can easily plot a regression line in ENGINE SIZE VS CO2 EMISSION plot.

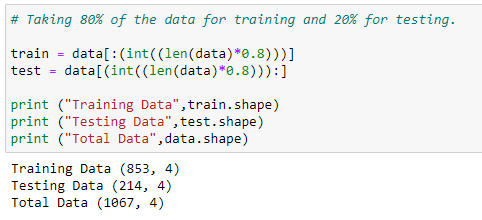
(9) Now we will divide our dataset into 2 parts. One for training data and another for testing data. We’ll use 80% of the data for training and 20% of data to test our predictions.

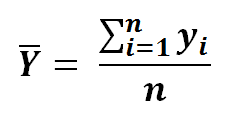
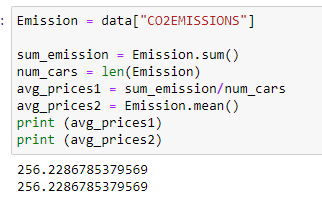
(10) Finding the mean of CO2-EMISSION :

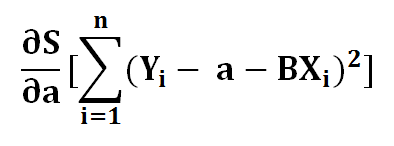
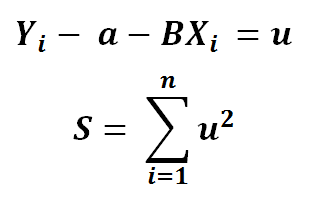
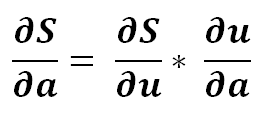
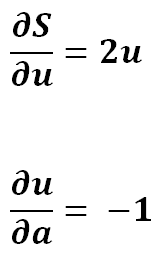
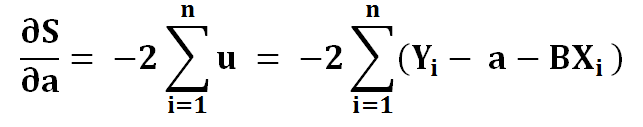
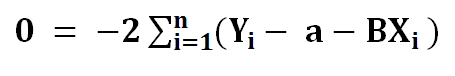
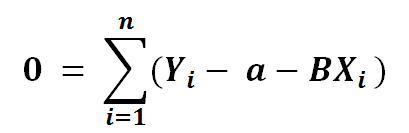
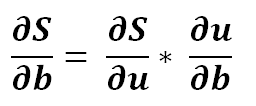
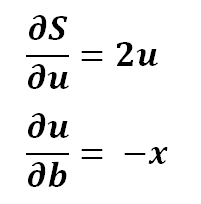
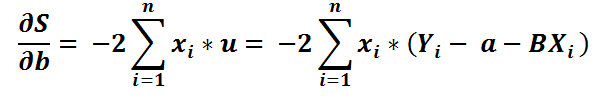
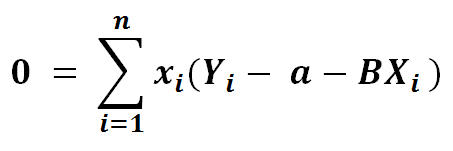
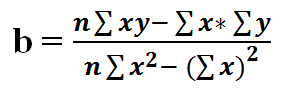
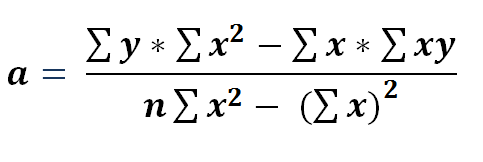
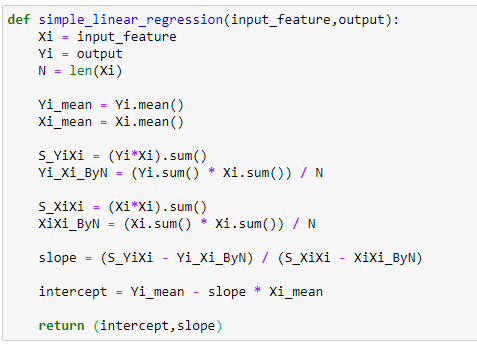
(11) Main function to find slope and intercept. Go check out my last article to understand the derivation of formula used here.

(12) Testing our function with basic data :

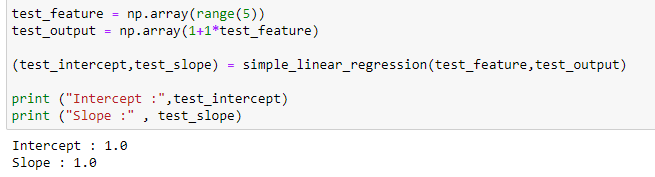
Voila! It works perfectly!!

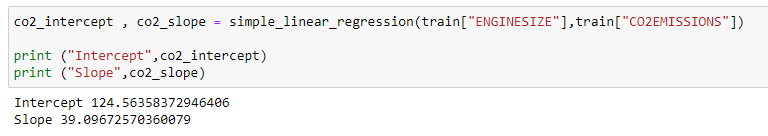
(13) Finding the Slope and Intercept for our actual data :

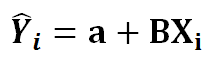
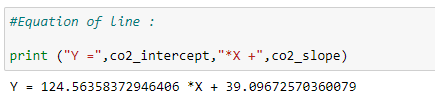
(14) Now that we have our Slope and Intercept with us we can make our regression line :

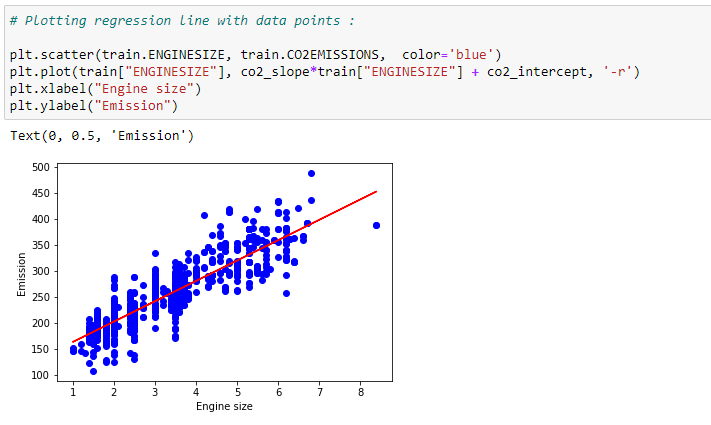
(15) Plot the regression line to visualize it :

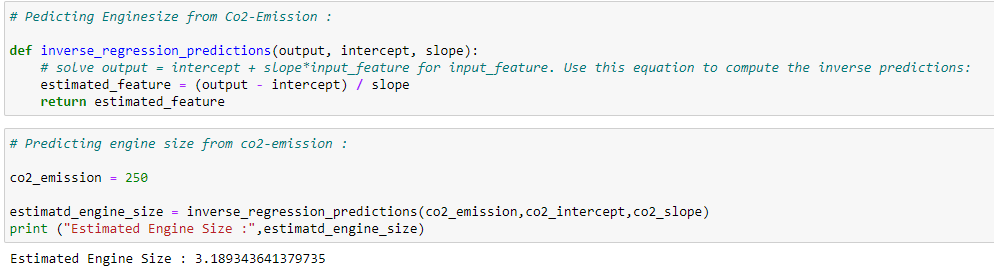
(16) Now we’ll predict the values with our model. But first we need to make a function for that :

(17) Can we predict the engine-size from co2-emission? Of course!! Here’s how to it…

Now it’s time to check how well our model performed in predicting the testing values. There are many methods to calculate the error/accuracy of a model. Here we’ll cover a few of them

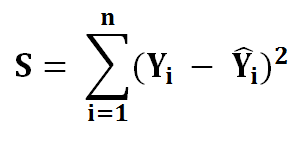
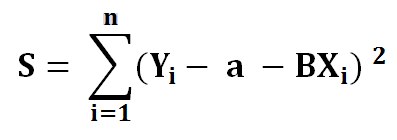
(1) Residual_Sum_of_Squares :
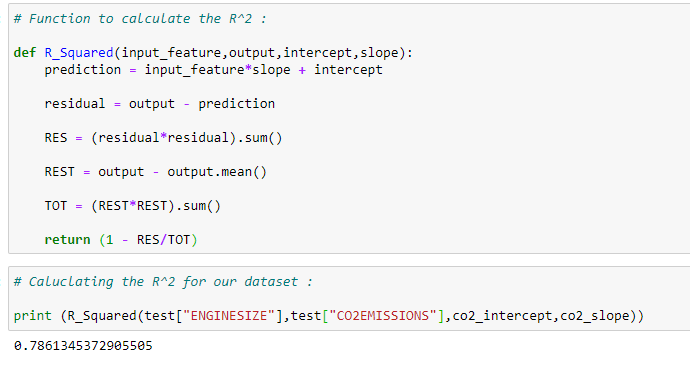
(2) R-Squared :

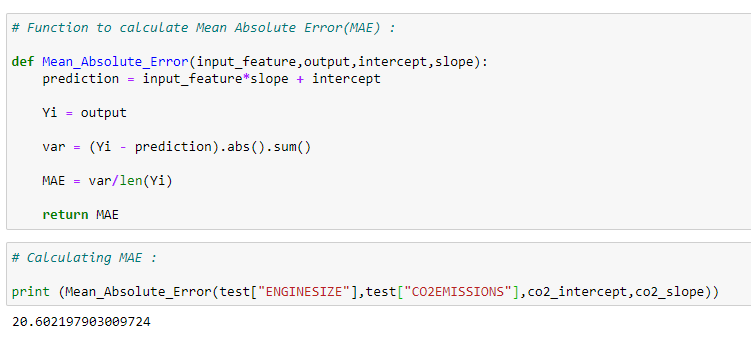
(3) Mean_Absolute_Error (MAE):

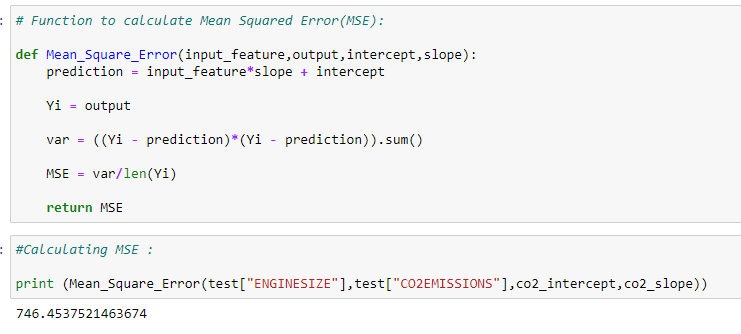
(4) Mean_Squared_Error(MSE):

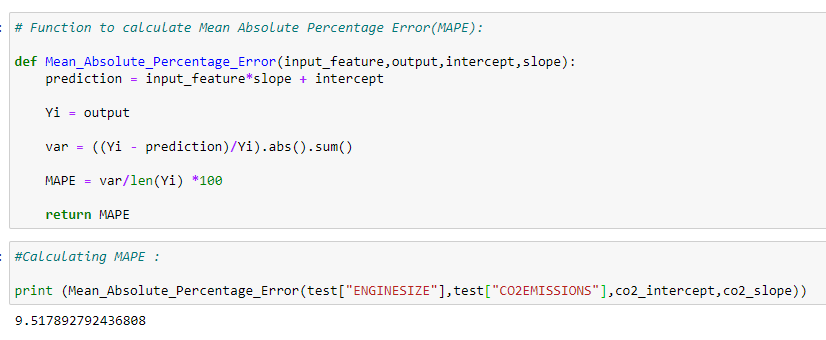
(5) Mean_Absolute_Percentage_Error(MAPE):

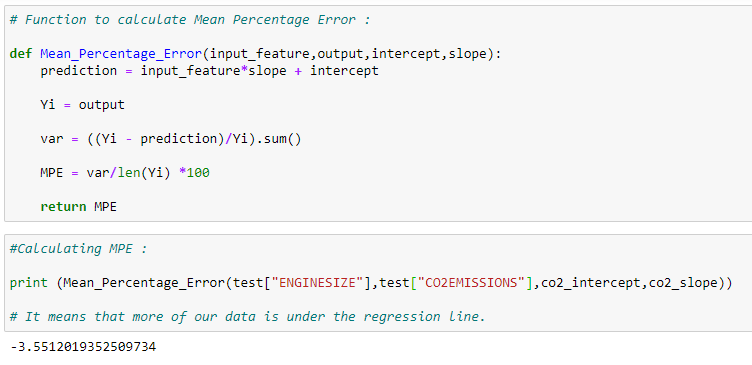
(6) Mean_Percentage_Error(MPE):

In summary, in this article we saw how we can implement simple linear regression without scikit-learn. It’s a lot of work right? But wait..!! There is an easy way to perform the same calculations with same output using some python libraries. In the next article we’ll see how we can perform such complex calculations in minutes with scikit-learn.

In my future articles I will try to show which accuracy model is best for different kind of datasets.

*******

You can download the code and some handwritten notes on the derivation from here : https://drive.google.com/open?id=1_stSoY4JaKjiSZqDdVyW8VupATdcVr67

If you have any additional questions, feel free to contact me : shuklapratik22@gmail.com

Linear Regression Complete Derivation (3/5)

Spongebob Characters - Welcome to Spongebob's Fan Club!

In the last article we saw how can find the regression line using brute force. But that is not that fruitful for our data which is usually in millions.So to tackle such datasets we use python libraries, but such libraries are built on some logical theories,right? So let’s find out the logic behind some creepy looking formulas. Believe me the math behind it is sexier!

Before we begin, the knowledge of following topics might be helpful!

  • Partial Derivatives
  • Summations

Are you excited to find the line of best fit?


Let’s start by defining a few things

1) Given n inputs and outputs.

2) We define the line of best fit as…

3) Now we need to minimize the error function we named S…

4) Put the value of equation 2 into equation 3.

To minimize our error function, S, we must find where the first derivative of S is equal to 0 with respect to a and b. The closer a and b are to 0, the less total error for each point is. Let’s find partial derivative of a first.

Finding a :

1 ) Find the derivative of S with respect to a..

2 ) Using chain rule.. Let’s say ..

3) Using partial derivative..

4) Expanding …

5) Simplifying…

6) To find extreme values we put it to zero…

7) Dividing the left side with -2…..

8) Now let’s break the summation in 3 parts..

9) Now the summation of a will be an….

10) Substituting it back in the equation…

11) Now we need to solve for a..

12) The summation of Y and x divided by n, is simply it’s mean..


We’ve minimized the cost function with respect to x. Now let’s find the last part which S with respect to b.


Finding B :

1 ) Same as we done with a..

2) Finding the partial derivative…

3) Expanding it a bit..

4) Putting it back in the equation..

5) Let’s divide by -2 both sides..

6) Let’s distribute x for ease of viewing …

Now let’s do something fun!! Remember we found the value of a earlier in this article? Why don’t we substitute it? Well, let’s see what happens!!

7) Substituting value of a…

8) Let’s distribute the minus sign and x…

Well, you don’t like it? Let’s split up the sum into two sums…

9) Splitting the sum..

10) Simplifying…

11) Finding B from it..

Great!! We did it!! We have isolated a and b in form of x and y. It wasn’t that hard, was it?

Still have some energy and want to explore it a bit!

12 ) Simplifying the formula…

13) Multiplying numerator and denominator by n in equation 11…

14) Now if we simplify the value of a using equation 13 we get…

Summing it up :)

If you have a dataset with one independent variable, you can find the line that best fits by calculating B.

Then substituting B into a…

And finally substituting B and a into line of best fit…

Moving Onwards,

In next article we’ll see about how we can implement simple linear regression from scratch (without sklearn) in python.

And please let me know whether you liked this article or not! I bet you liked it!!

You can download the code and some handwritten notes on the derivation from here : https://drive.google.com/open?id=1_stSoY4JaKjiSZqDdVyW8VupATdcVr67

If you have any additional questions, feel free to contact me : shuklapratik22@gmail.com